This project emerged to help my sister, who needed to extract information from a rotameter for her final degree project. The experiments she had to perform lasted about an hour, and she had to be attentive to the float's oscillations to take data.
When she told me she spent almost two hours a day looking at a rotameter (a word I still find hard to believe exists), I told her to record a video of the rotameter and send it to me to see if I could come up with a solution, so she could dedicate her time to other things.
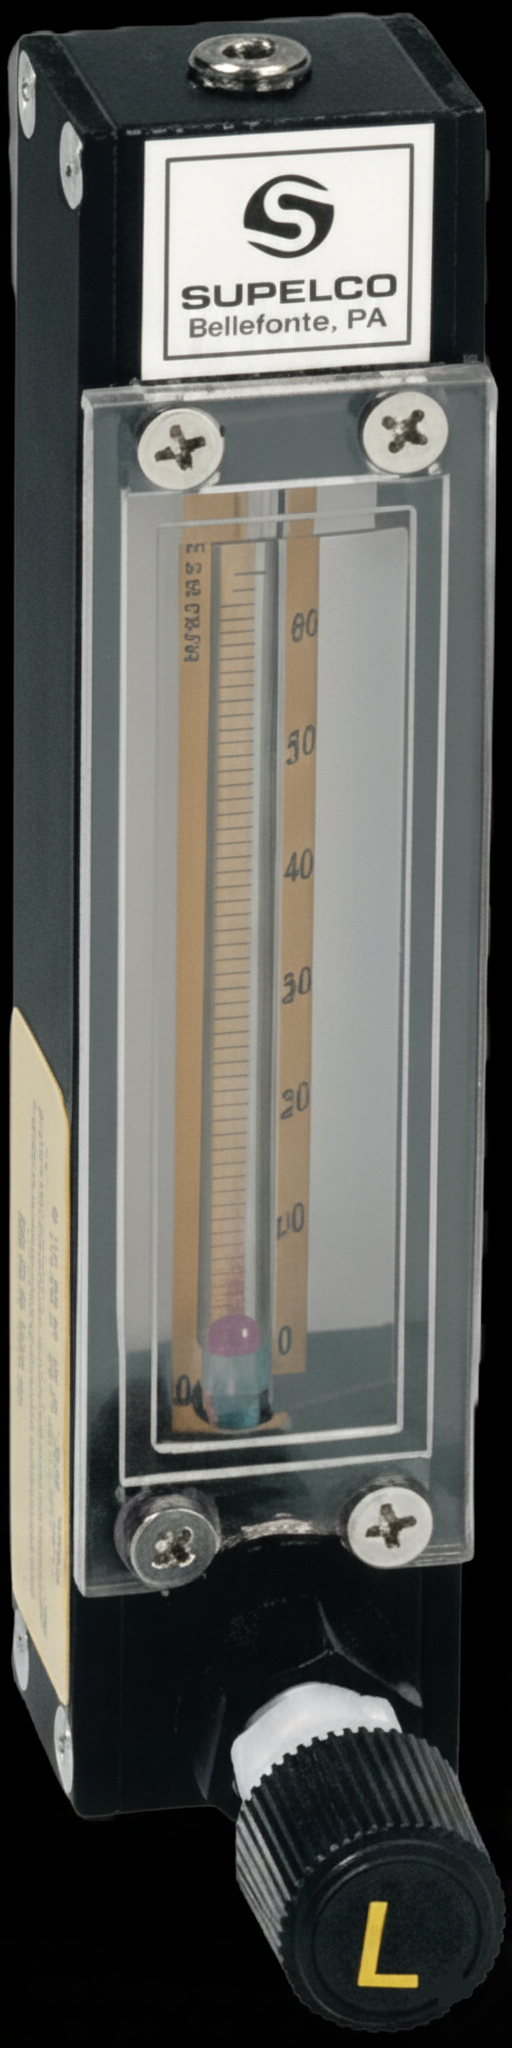
A rotameter is an instrument for measuring flow rate that consists of a tapered transparent tube through which a fluid flows. Inside, a float (the ball) rises or falls according to the flow rate: as the flow increases, the ball rises until it reaches an equilibrium position.
To illustrate the problem, the video of the experiment is shown below.
In a real-world scenario, the movement of the ball is much more stable. However, we decided to increase the speed to experiment and better analyze its dynamic behavior.
The final goal was to plot the position of the ball as a function of time. The process was divided into three stages:
- Frame Extraction: Given an FPS value, the video is sampled to obtain individual frames.
- Ball Detection using Template Matching:
In each frame, the ball is located using the template matching technique with normalized cross-correlation (
cv2.TM_CCOEFF):- A reference image of the ball is loaded.
- Using
cv2.matchTemplate(), this template is compared with the frame to generate a similarity map. - The position of maximum correlation (
max_loc) is identified usingcv2.minMaxLoc(), obtaining the (x,y) coordinates of the ball. - The vertical position (y-axis) is recorded for temporal analysis.
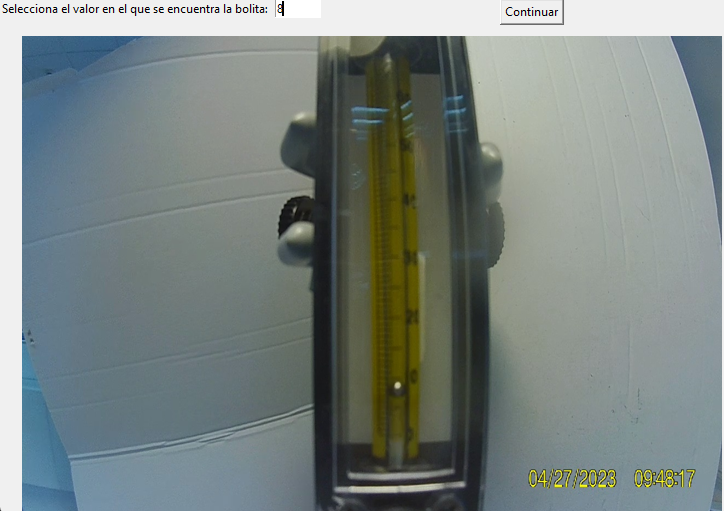
- Spatial Normalization:
Since the coordinates are in pixels, it is necessary to convert them to physical units. To do this, the highest detected position of the ball is displayed on the screen, and the user is asked for the maximum real position reached by the ball.
Using linear interpolation (
np.interp), the detected values are scaled to the range [0, maxReal], thus converting pixels to the desired unit of measurement.
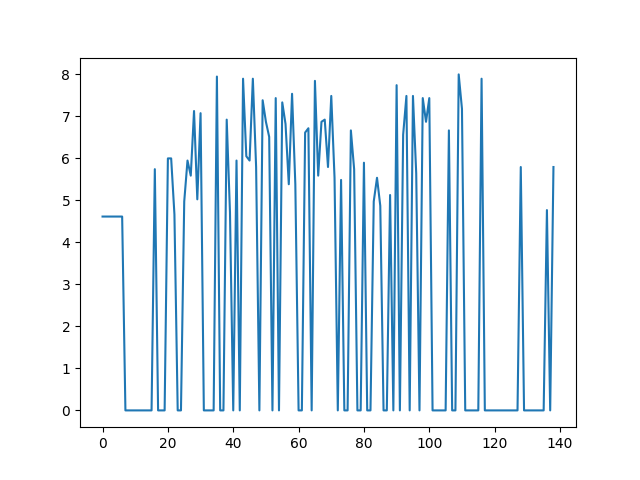
Below is the resulting graph representing the normalized position of the ball as a function of time: